Add a report
Set up a customized report in tabular format with the metrics and dimensions that are most important to you. Additionally, use charts within your report to visualize your data and gain key insights.
Get started
Before you set up this report, ensure that you have set the appropriate data configuration. For more information, see Set up your view.
To add a report, follow these steps:
- In the left navigation pane, do one of the following:
- Select
 next to Reports.
 - Go to All reports and select New report.
- Select
- On the right-side pane, you can choose the metrics that you want to measure, and the dimensions by which you want to group the data.
- Under Dimensions, choose the view type and the dimensions by which you want to group the data.
- Under Metrics, select the metrics that you want to measure.
- Select Charts to visualize how your key metrics and in-app events change over time. See Charts for more information.
- If you change dimensions, metrics, or any settings, you need to select Reload data to generate the report again.
- Select Save on the upper-right section of the page to save your report. You must save your report for it to be available on the All Reports page. For more information, see Manage your report.
- Name your report.
- Select your visibility settings:
- Private (default): Only available to you on the report list
- Public: Available for anyone in your team on the report list
- Select Save.
 next to Reports.
You have successfully created and saved a new report.
Global data configuration
At the top of the report page you can choose the appropriate settings to determine what data is used to create your report. For more information, see Set up your view.
Report table
Use the two view buttons to control how your data is displayed. You can switch between the chart view, the table view, or show both at the same time. Changing views does not affect your filters or data, only how the information is presented.

When you select Edit Table you can choose the dimensions, attributes and metrics that you want to use to define your report.
Dimensions
- Under Dimensions, choose the view type and the dimension by which you want to group the data. There are two options to view your dimensions:
- Flat table - View your data as a regular table, separating your selected dimensions by columns.
- Pivot table - View your data with nested dimension rows. You can customize how to summarize, sort, or organize your report.
- To add multiple dimensions to a report, select + Add, and choose another dimension.
Select
 next to its name to delete a dimension or select next to Columns to delete all selected dimensions. You need to select at least one dimesion to create a report.
 - Select and move
 to change the order of the dimensions in your report.
 next to its name to delete a dimension or select
  to change the order of the dimensions in your report.
For detailed information about the dimensions, use our Datascape dimensions glossary.
Metrics
Under Metrics, choose the metric or event that you want to measure. Use the Search field to search for metrics or events, or use categories to navigate to the metric that you want to measure. Based on the metric that you select, you might have to choose additional options. For example, Events lets you choose from your list of events. You can select as many results as you need by selecting them from the list. You can select multiple consecutive items by selecting an item, holding Shift on your keyboard, and selecting the last item you want to include. The following categories are available:
- Deliverable KPIs
- Cohorted Performance
- SKAdNetwork
- Fraud
- Qualifiers
- Aggregated Ad Revenue Metrics
- Custom Metrics
To add multiple metrics to a report, select + Add, and choose another metric. Select
next to its name to delete a metric or select next to Columns to delete all selected metrics. You need to select at least one metric to create a report.Select and move
to change the order of the metrics in your report.
Examples:
- If you choose the
Clicksmetric, you need to choose its data source. - If you choose the
Cohort Sizemetric, you need to choose the cohort period. You can choose multiple cohort periods. When you choose multiple cohort periods for theCohort Sizemetric, each metric is added separately to the list of metrics.
For detailed information about the metrics, use our Datascape metrics Glossary.
Charts
Select  Charts to visualize how your key metrics and in-app events change over time. You can customize data visualization using multiple metrics and dimensions in Datascape.
Use the horizontal view ( ) button to view the charts in full width, one bellow the other.
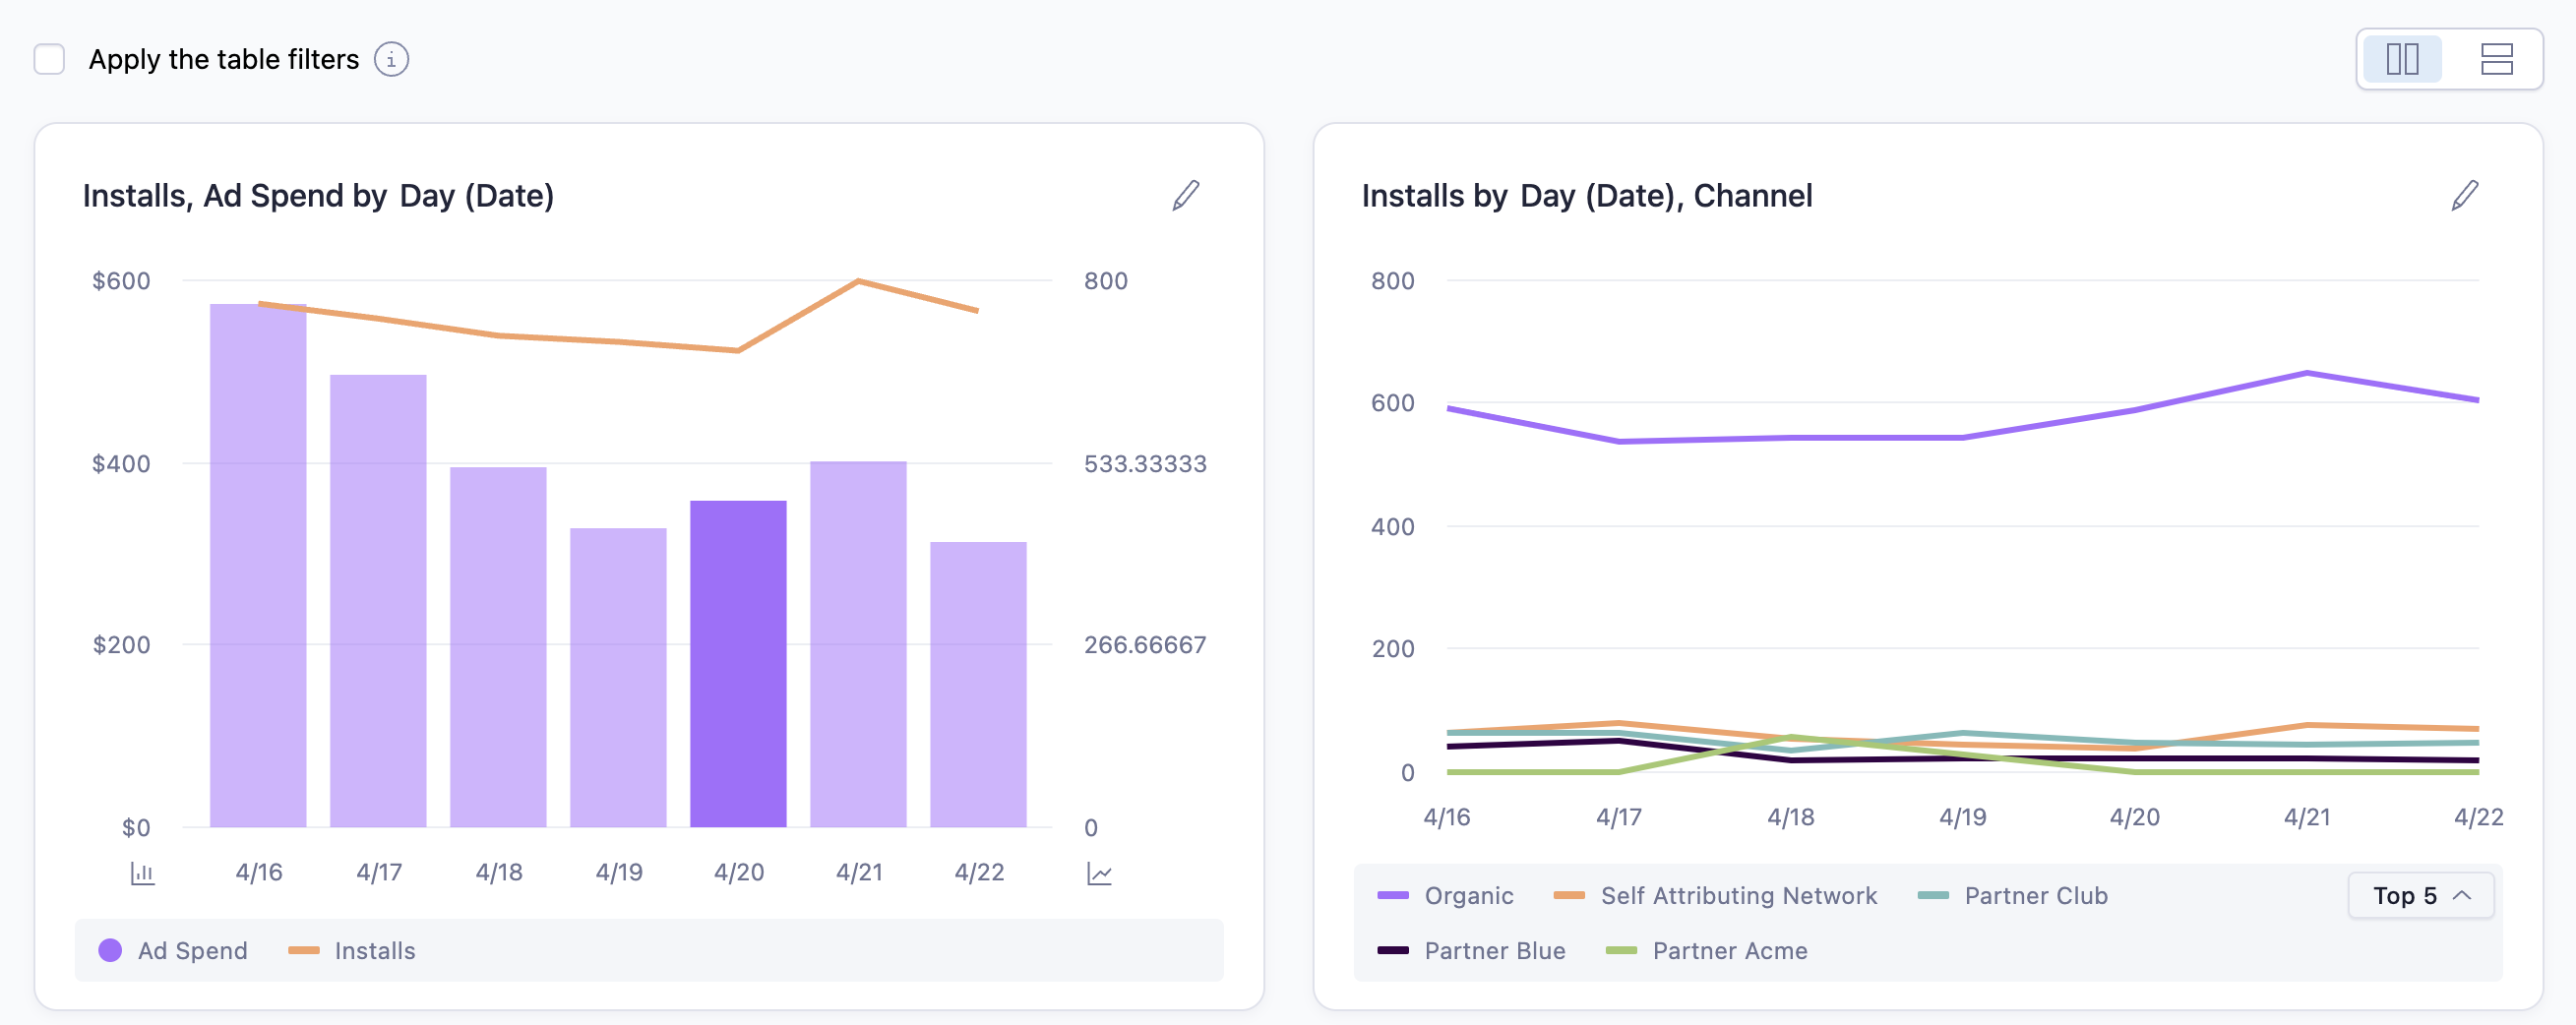
Side-by-side charts.

Manage chart data
There are two ways you can manage what data your charts use:
Using the table filters

Your chart view displays the following:
- Your selected dimension on the X axis. You can select up to two dimensions. If you select more than one dimension, Datascape uses the following logic:
- Time-related dimensions always take priority
- Otherwise, the first selected dimension takes priority
- Your selected metrics on the Y axis. See metric types to learn more about them and their restrictions.
- Your metric's data visualization, presented as lines and/or bars.
Metric types
To make the most out of charts, metrics are divided into different types. These types allow Datascape to give a more robust representation of your data. For example, you want to see the number of app installs over a certain period represented on a timeline. At the same time, you want to visualize the in-app revenue for the same period, represented in bars.
Here are the available metric types:
| Metric type | Description | Example metric |
|---|---|---|
Number  | Uses numbers as data representation in the Y axis | Installs |
Currency  | Uses amounts from your app's defined currency in the Y axis | IAP revenue |
Percentage  | Uses percentage amounts as data representation in the Y axis | Retention (Cohort Period) |
Edit charts
To modify your metric selection in the chart, follow these steps on your report page:
- Select Charts, and select
 for the chart that you want to modify.
 - In the Metrics shown as lines section, add metrics by selecting the + (Add a metric) button.
- In the Metrics shown as bars section, add metrics by selecting the + (Add a metric) button.
- In the Dimensions section, add up to two dimensions by selecting the + (Add a dimension) button.
- Select Done.
 for the chart that you want to modify.
Filtering data
Datascape enables you to choose specific items to analyze in the chart by selecting their names.
When adding more than one dimension, you can select a pre-defined filter to show a number of metric items per dimension in the chart. Available filters:
- All
- Top 5 (default)
- Top 10
- Bottom 5
- Bottom 10
Select All from the list allows you to see all the items of a selected dimension. To make a custom selection:
- Select All.
- If the list of items is short, you can select which elements to show by selecting their names.
- If the list is long, select the button showing the number of remaining items. For example: +14.
- Search for your preferred item by metric name or dimension name, or directly select it from the list.
- Select Close.
Report structure
This is how your report is structured:
- The dimensions that you selected while creating the report are always displayed as the first columns of the table.
- The next columns display data for the metrics that you selected.
There are two options to set up and view your data in the report:
Flat table
Flat table is the default option to view your report data. You can add more than one dimension and change their order as described in the dimensions section. A flat table presents the dimensions per column as well as all the selected metrics. You can drill down into your data to get a more granular result.
Drill down into your data
Use the drill down feature to get more granular insights by filtering into the following dimensions:
Network dimensions:
Channel>Campaign name>Adgroup name>Ad nameCampaign ID>Adgroup name>Ad name
Attribution dimensions:
Network (Attribution)>Campaign (Attribution)>Adgroup (Attribution)>Creative (Attribution)
Activate drill down
To check if your data supports the drill down feature, do the following:
- Hover over the row for the dimension in the report. A link appears on the name if drill down is available.
- Select the link to dig deeper into your data.
As soon as you drill down into a dimension, the  icon appears next to that dimension under Edit table > Dimensions. This icon indicates that the drill down feature is active. The drilled down dimension also appears next to the originally selected dimension.
Exit drill down
To exit the drill down feature, do one of the following:
- Select the
 icon next to the dimension under Edit table > Dimensions.
 - Use the breadcrumb navigation to go back to the dimension that you drilled down from.

Pivot table
A Pivot table serves as a dynamic tool for arranging, restructuring, or grouping your data. You can customize the nesting order of the dimensions and apply filters to each of them, which allows you to focus on what is important for your campaigns. The benefits of using pivot table are:
- Managing extensive rows or columns containing useful data.
- Rotate dimensions to facilitate the extraction of meaningful insights.
- Apply filters on your preferred dimensions to narrow-down your data.
Set up the pivot table
Follow these instructions to customize your data visualization table:
- On the right-side pane, select
 Edit table > Dimensions.
 - Select the Pivot table option.
- Add or delete your preferred dimenions as described in the dimensions section.
- Select and move to change the order of the dimensions in your report.
 Edit table > Dimensions.
Every time you change the order of the dimensions, the table rebuilds itself to show the new dimension order.

Use the pivot table
After making adjustments to the dimension order, interact with the table to get a deeper representation of your data.
On the dimension rows, select  to expand its content and view the nested dimensions. You can continue expanding the content for the number of dimenions selected. For example, if you selected the Channel, App, and Campaign Name dimensions, you can go two levels in, from channels to apps, and from apps to campaign name.
You can go back to setting up the pivot table to make changes. Add, delete, or change the nesting order of your dimensions. Remember to select Reload data after any modification.

Select time periods
You can view your data for a particular time period or compare data between periods. Here are two examples that illustrate how the data looks like after selecting a time period or selecting two periods to compare.
Viewing data for a specific time period

Comparing data between time periods

➡️ Up Next: Use and manage your report