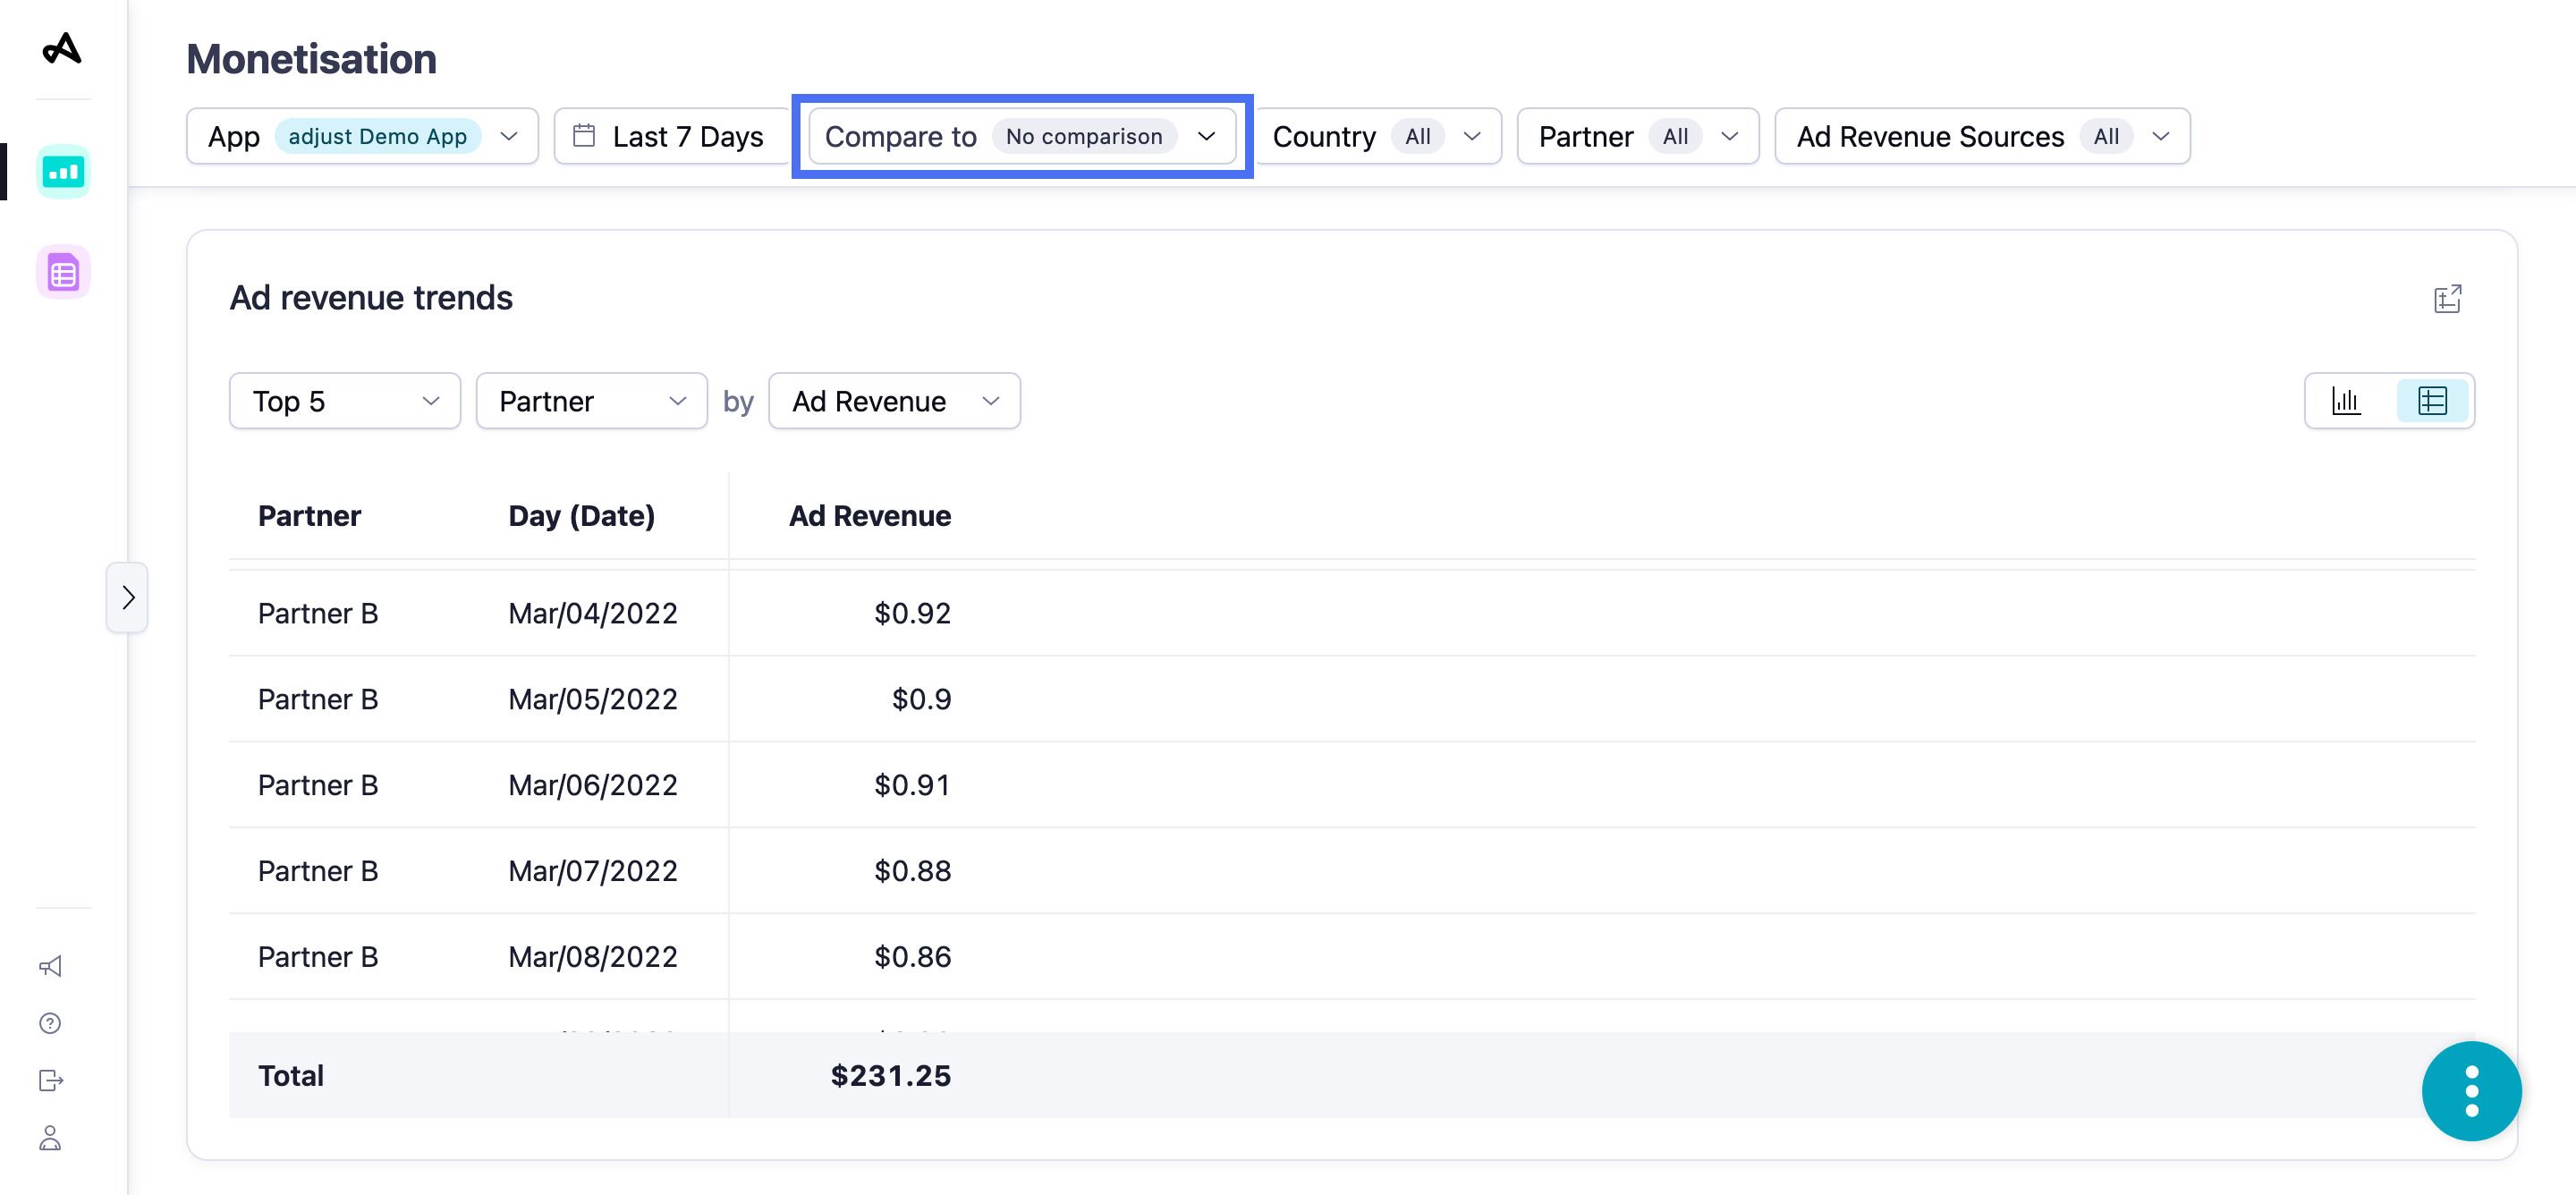
Ad revenue trends
The Ad revenue trends widget offers a quick view into give you quick decision-making power to maximize your budgets. You can analyze the total ad revenue, the number of ad impressions, or ad revenue per mille (RPM) by the dimensions that you want to measure.
Your widget displays data from the following sources, by default:
| Data source | Definition |
|---|---|
| Attribution source - First | User's original attribution source |
| Attribution status - All | Installs and reattributions |
| Attribution type - All | Clicks and impressions |
| Ad spend source - Mixed | Attribution and Network sources |
Set up the Ad revenue trends widget
Before you set up this widget, ensure that you have set the appropriate filters. For more information, see Set up your view.
The Ad revenue trends widget shows a line chart comparing the performance of different dimensions and ad revenue metrics in the selected period. By default, you can see the comparison of Top 5 channels by the Ad RPM metric.
You can also choose to analyze performance for the metrics by the following dimensions:
| Dimension | View by |
|---|---|
| App |
|
| Country | |
| Channel | |
| Total Revenue | - |
Select  (Table view) to view the data in table format. Select
  (Chart view) to switch back to the bar chart.
Select  (Open as report) to view the data in the form of a new report.
Use the Ad revenue trends widget
Hover over any data line in a chart to see more information about the data.
Hover over any title in the chart legend to highlight the data line in the chart that corresponds to that title.
Select the title in the chart legend to hide the data line for that title in the chart. Select the title again to reveal the data line.

