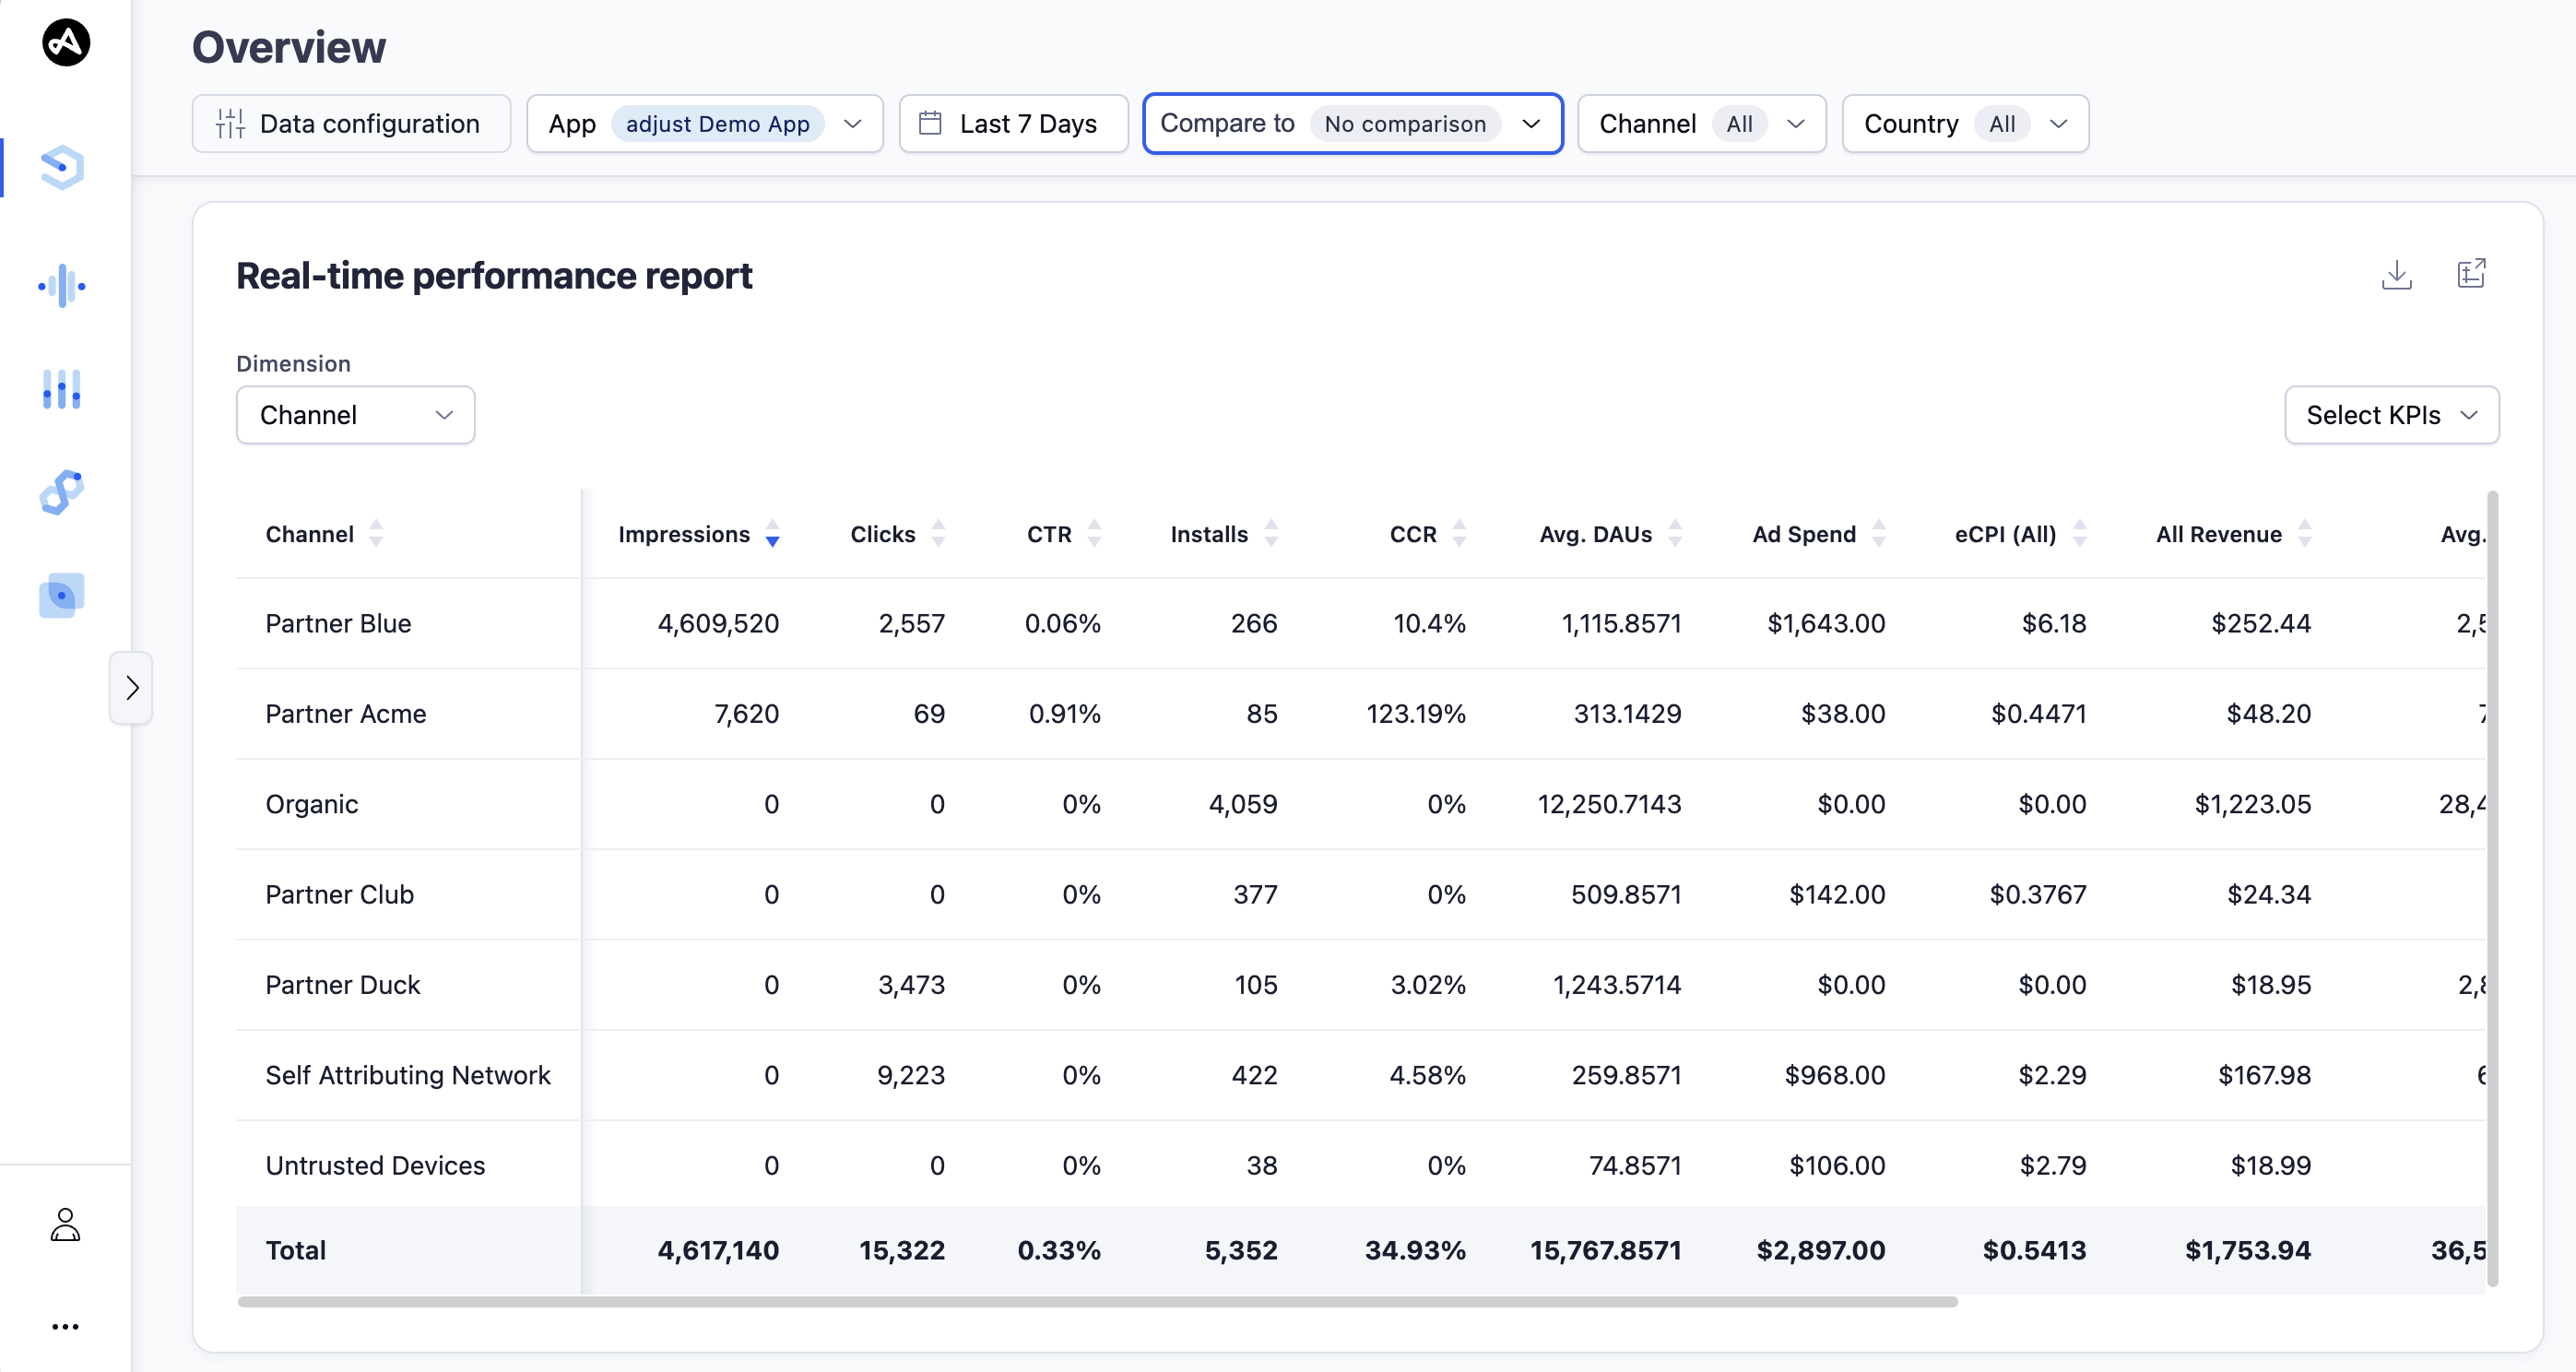
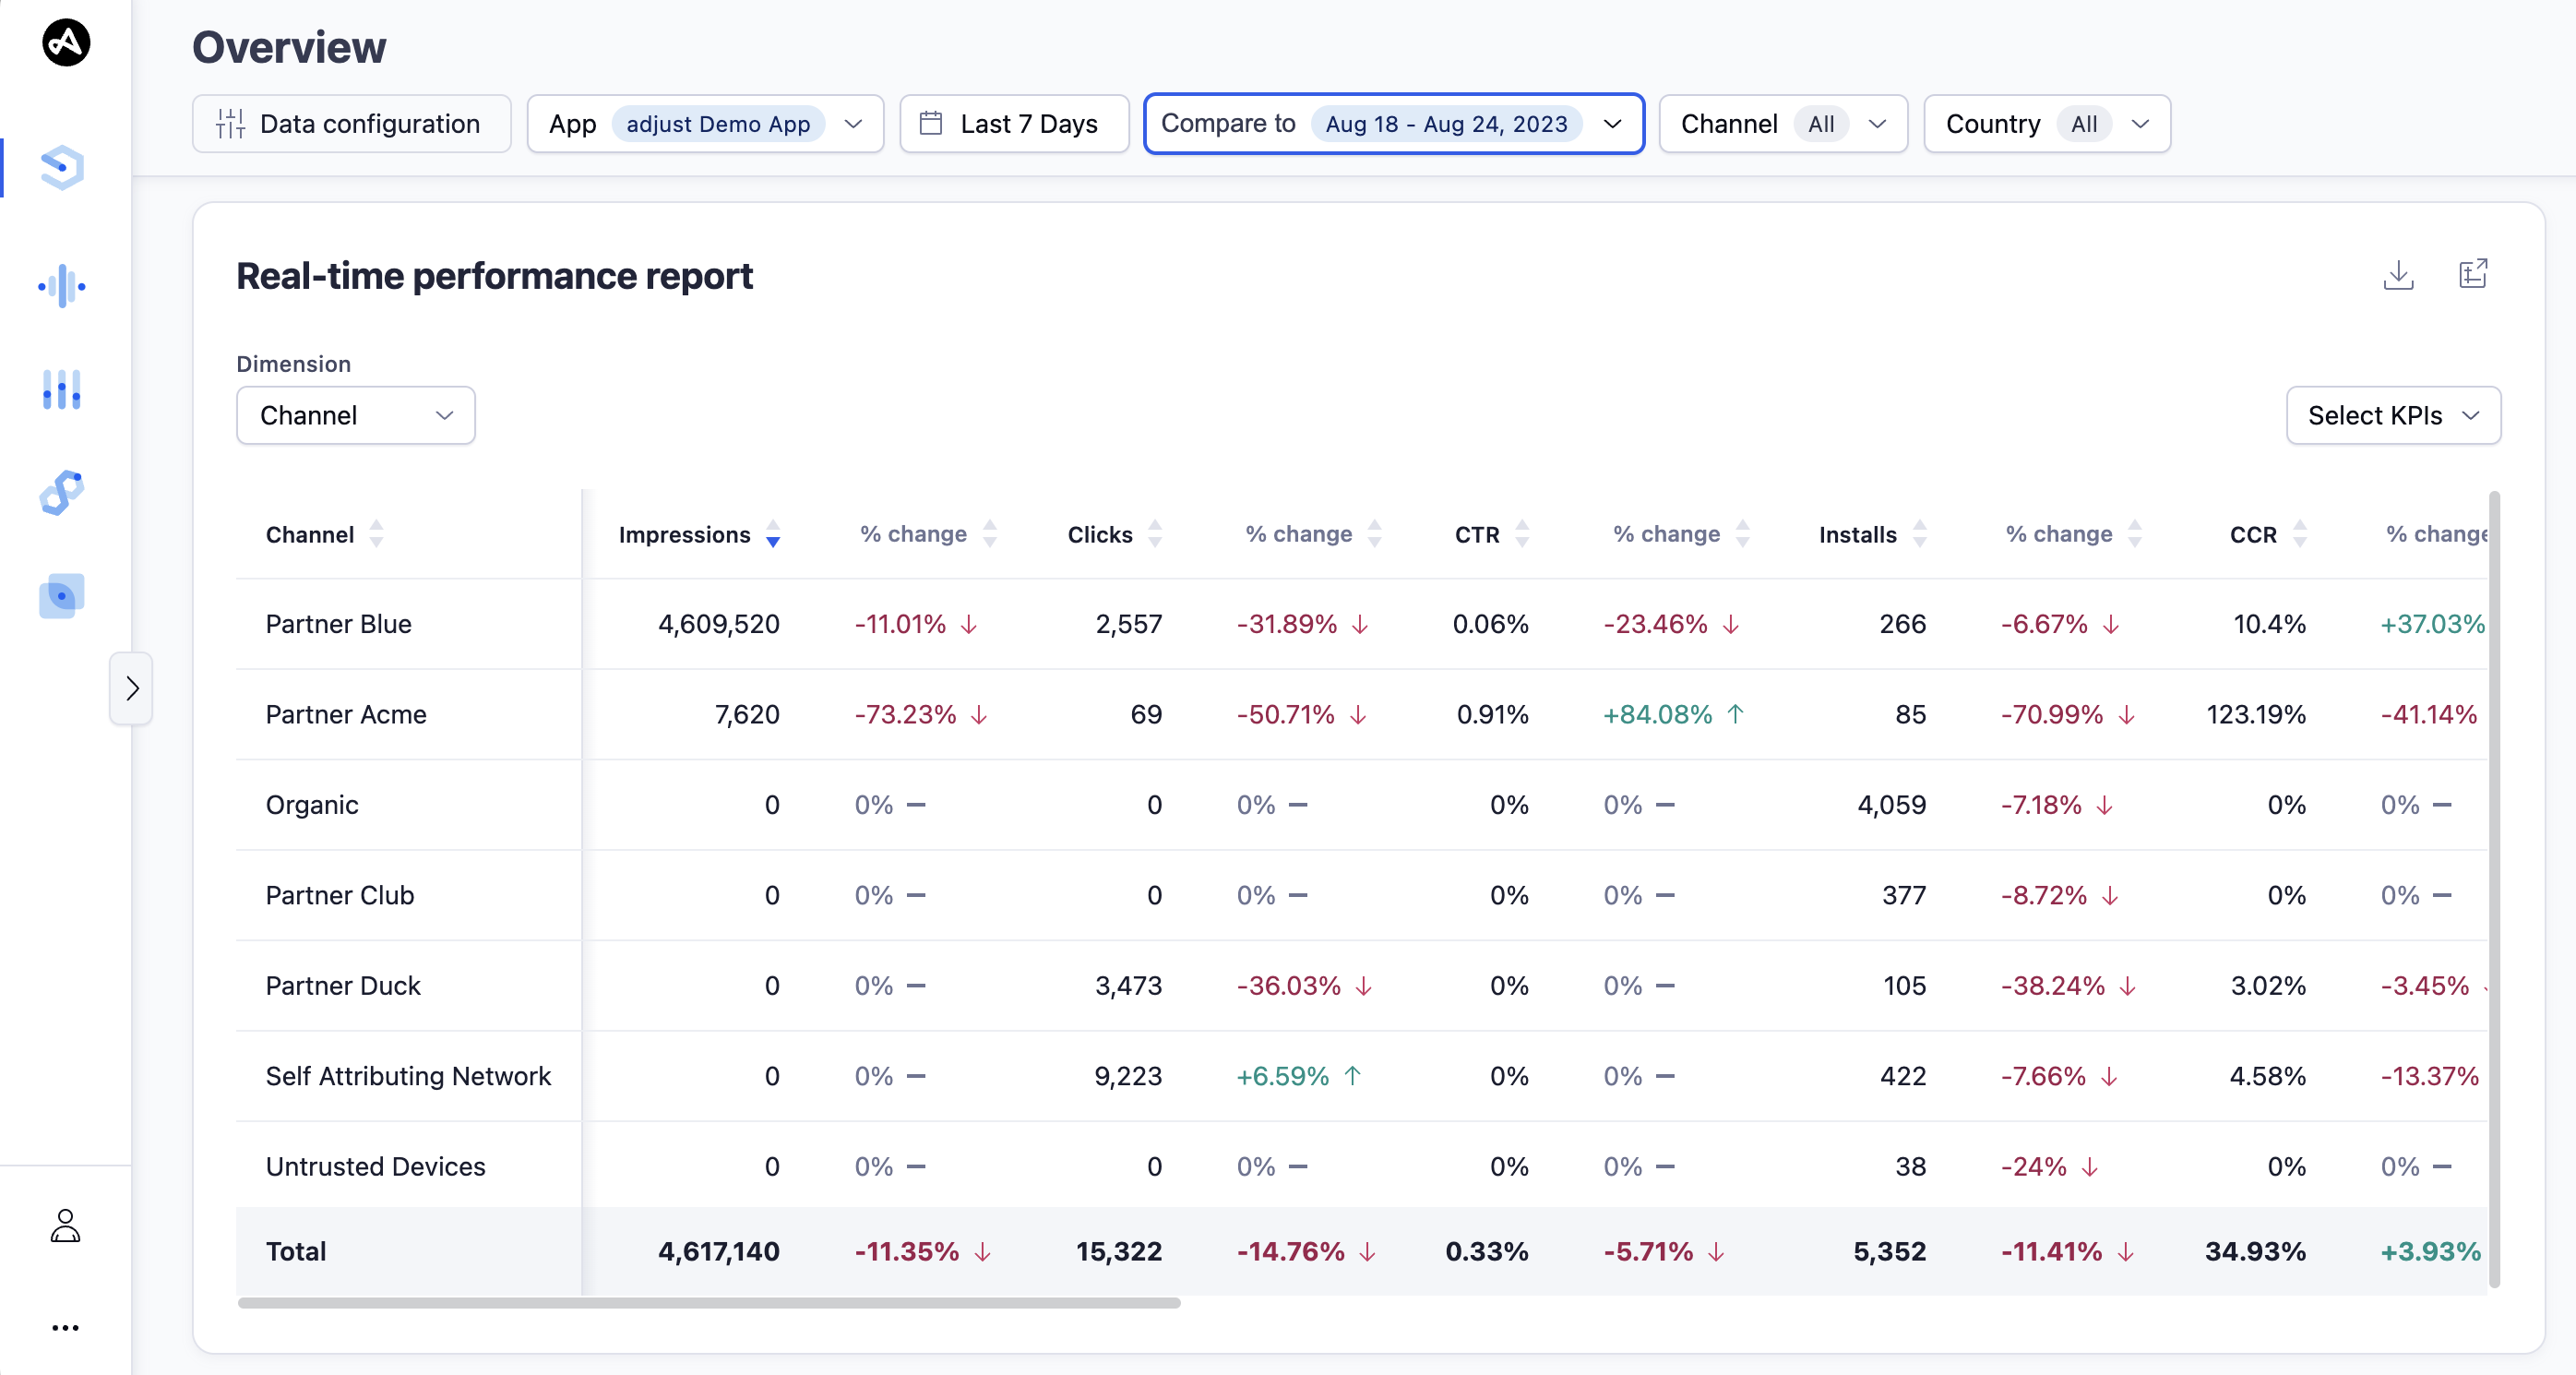
Real-time performance report
The Real-time performance report widget shows a breakdown of the performance of your app marketing campaign. You can choose different metrics and dimensions to analyze your data.
Your widget displays data from the following sources, by default:
| Data source | Definition |
|---|---|
| Attribution source - First | User's original attribution source |
| Attribution status - All | Installs and reattributions |
| Attribution type - All | Clicks and impressions |
| Ad spend source - Mixed | Attribution and Network sources |
Set up the Real-time performance report widget
Before you set up this widget, ensure that you have set the appropriate filters. For more information, see Set up your view.
By default, the Real-time performance report widget is a table that breaks down the metrics by Channel . You can break down the performance of your app marketing campaign by the following dimensions:
- App
- App store type
- Country
- Channel
- Campaign Name
Select  (Open as report) to view the data in the form of a new report.
Choose your metrics
Customize the widget to display the metrics that you are interested in. To customize the widget, follow these steps:
- In the Select KPIs list, choose the metrics that you want to view data for.
- Select Apply.
Great job, the widget is updated with your new metric selection.
Use the Real-time performance report widget
Select
 (Download) to download the report in CSV format.
Use the arrows in the table header to arrange the data in the columns, either alphabetically or in ascending or descending order.
 (Download) to download the report in CSV format.
