SKAN metrics trends
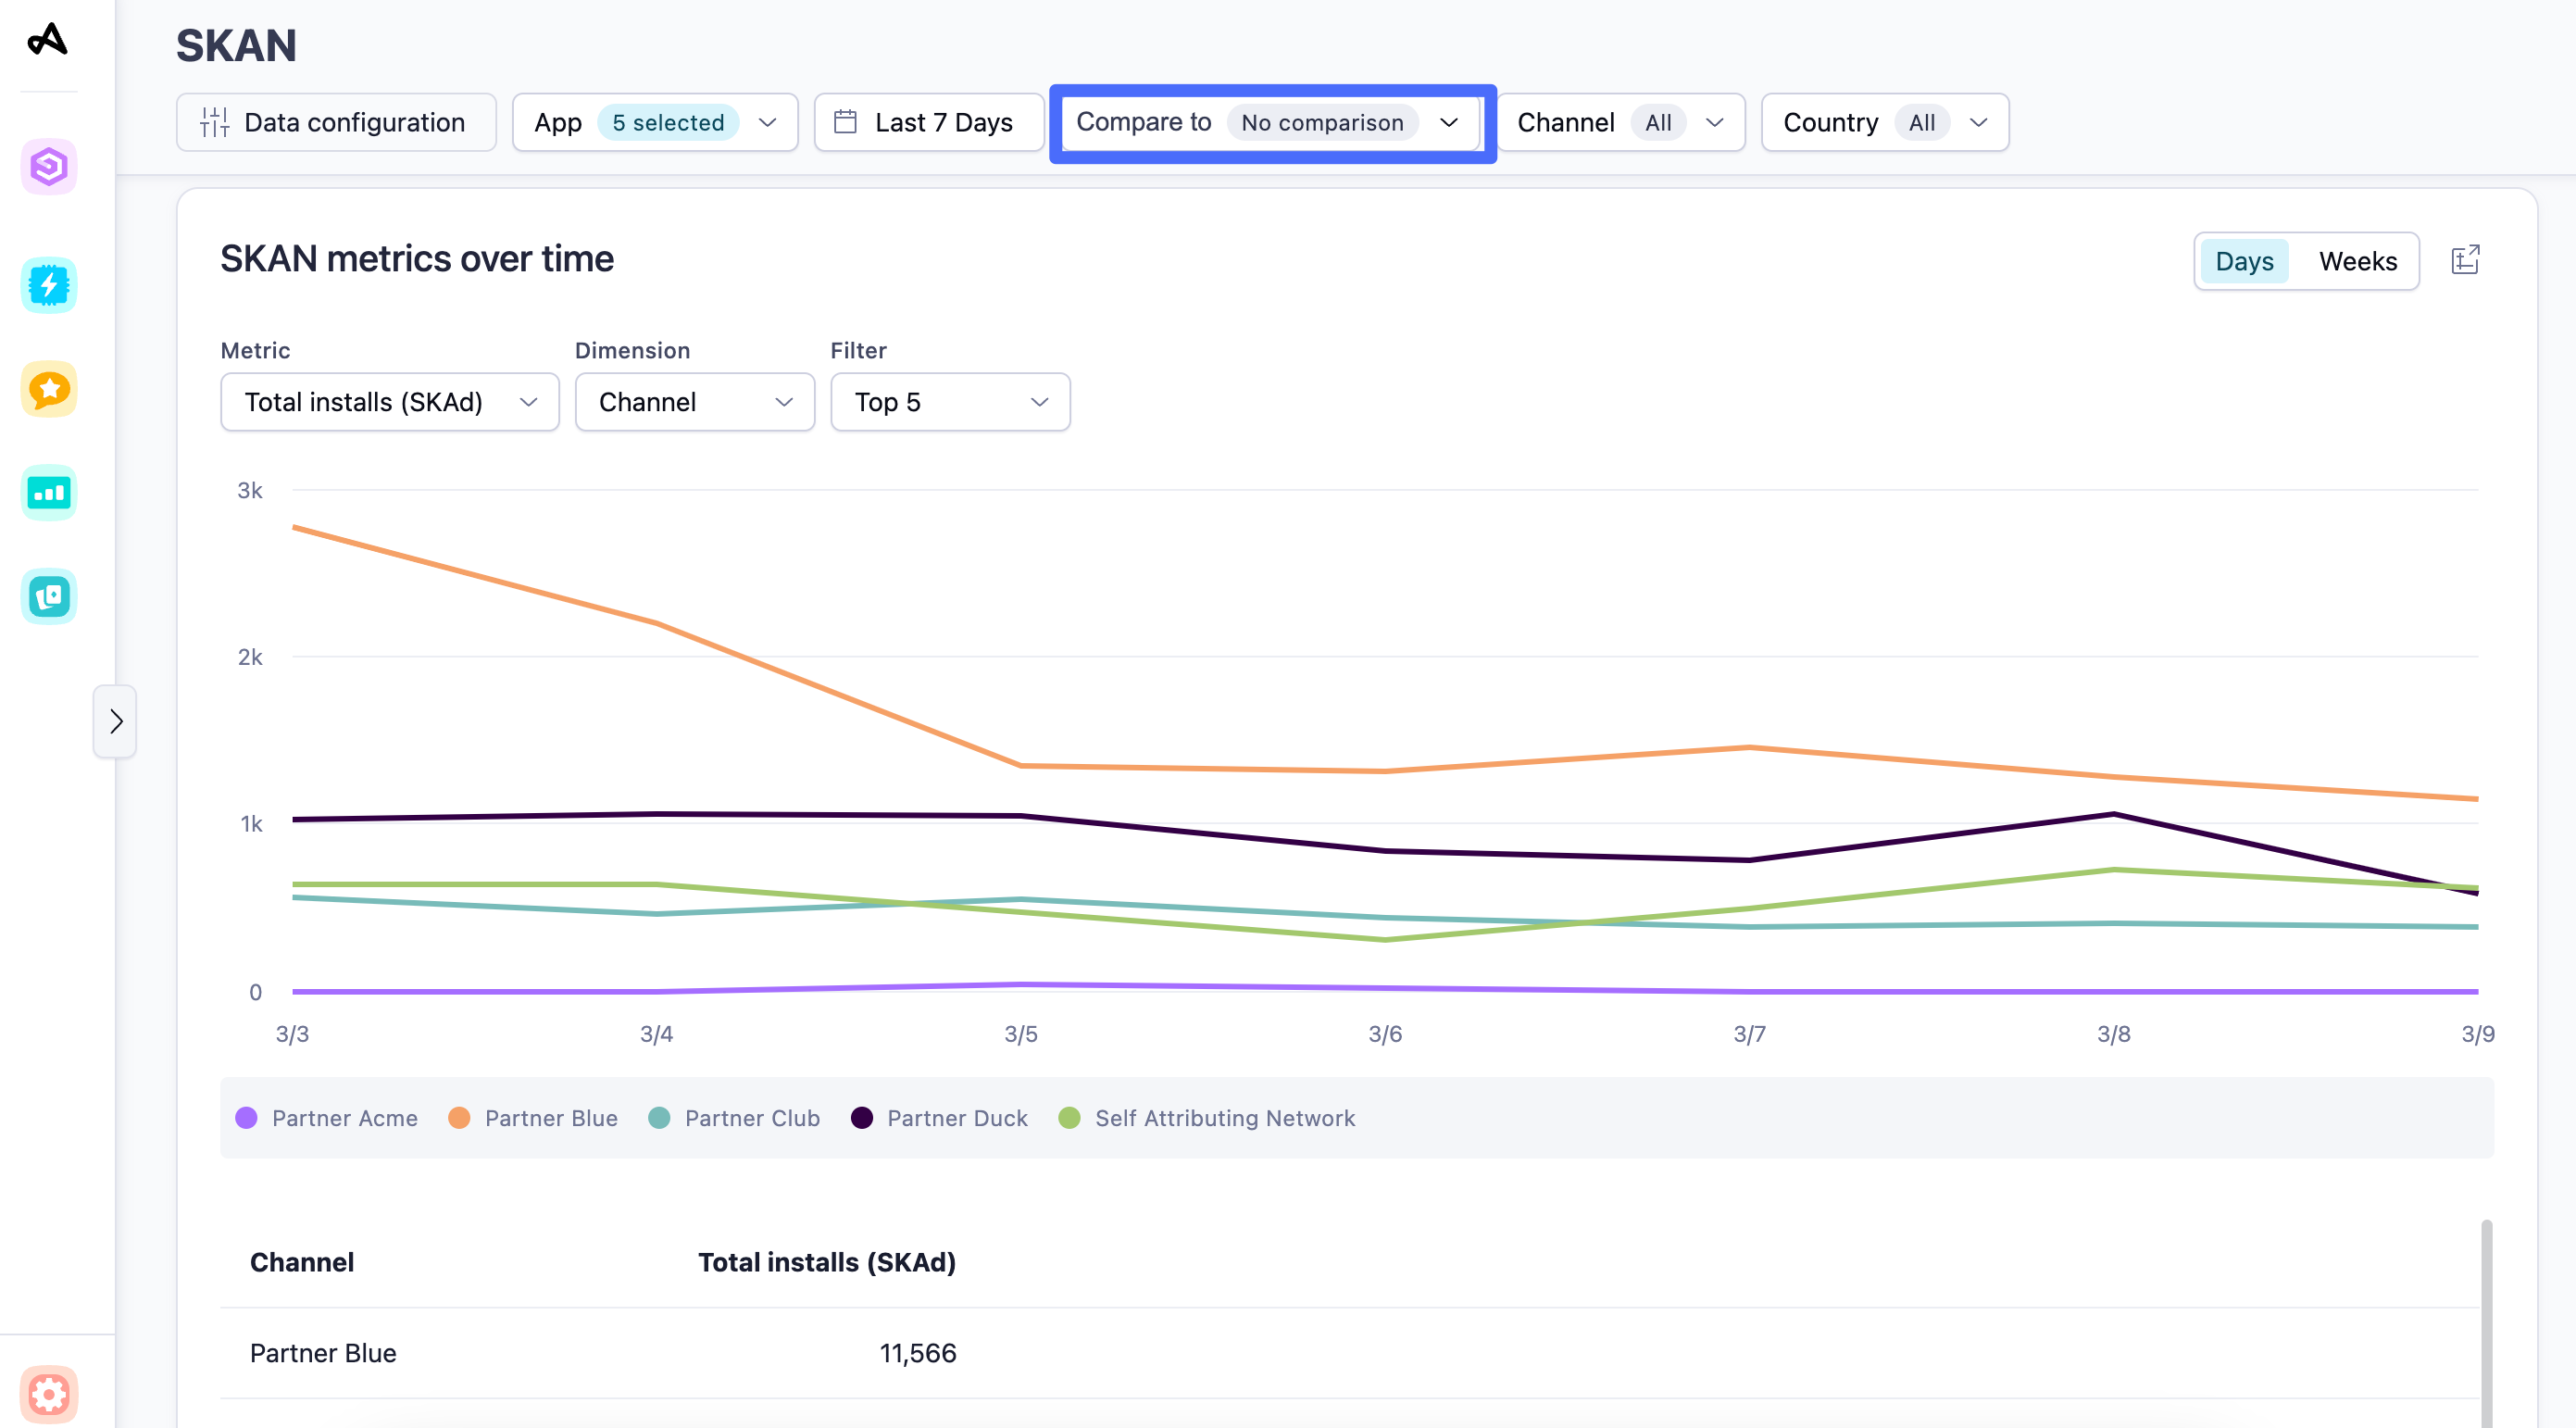
The SKAN metrics over time widget is a chart that displays a breakdown of your mapped metrics by the selected dimension. It also displays a table with the total number of installs for SKAN campaigns for the selected dimension.
Your widget displays data from the following sources, by default:
| Data source | Definition |
|---|---|
| Attribution source - First | User's original attribution source |
| Attribution status - All | Installs and reattributions |
| Attribution type - All | Clicks and impressions |
| Ad spend source - Mixed | Attribution and Network sources |
Set up the SKAN metrics over time widget
Before you set up this widget, ensure that you have set the appropriate filters. For more information, see Set up your view.
To see the conversion value rate, choose any event metric other than the default Total Installs (SKAN).
By default, the SKAN metrics over time widget is a chart that breaks down the distribution of conversion events by Channel and displays the Top 5. You can see the breakdown of conversion events by the following dimensions:
| Dimension | View by |
|---|---|
| App |
|
| Channel | |
| Campaign Name | |
| Adgroup Name | |
| Day (Date) | - |
Depending on the time period for which you are viewing data, you can select Days, Weeks, or Months to choose how granularly you want to break down the data.
Select  (Open as report) to view the data in the form of a new report.
Use the Conversion event breakdown widget
Hover over any data line in a chart to see more information about the data.
Hover over any title in the chart legend to highlight the data line in the chart that corresponds to that title.
Select the title in the chart legend to hide the data line for that title in the chart. Select the title again to reveal the data line.

